Network Exploit Update 2023.1.1

Background
I spent much time analyzing malware. One of my areas of focus was determining the objectives of malware operators. I always find hints in binaries and sometimes the plain messages sent back to the operators, which made this task easier.
Over time, I began to think of malware as puppets. These puppets may change. For example, they may use new loading methods or change to entirely new malware. However, the puppeteers are usually the same people or people with similar objectives.
One standard functionality typically found in backdoors is the ability to download files from infected computers. I used to overlook this functionality. However, it became pretty interesting once I developed the "puppet-puppeteer" analogy. Unless the computer logs filesystem operations, it is difficult to tell what files the malware operators exfiltrated from the computer by looking into the malware alone.
Why is that? Because the malware operators are the ones who make the decision on which files to download. The malware does not make such decision, i.e., it is not hardcoded. It is external to it.
One of Network Exploit's main goals is to shift cybersecurity professionals' focus from the malware binaries to what malware are doing on their operators' behalf. The previous insight made us develop the architecture we call Puppeteer as a step toward that goal.
The Puppeteer architecture
Puppeteer is the internal name of the architecture we use to build Network Exploit capabilities using Python as a scripting language.
We break all tools' logic into two parts at our discretion:
The lowest part of the logic runs on the target. A native implant carries out this part. This logic is as simple as reading a file or writing to virtual memory.
The rest of the logic runs on your computer, not the target. This part is what makes decisions, transforms data, and presents information to you.
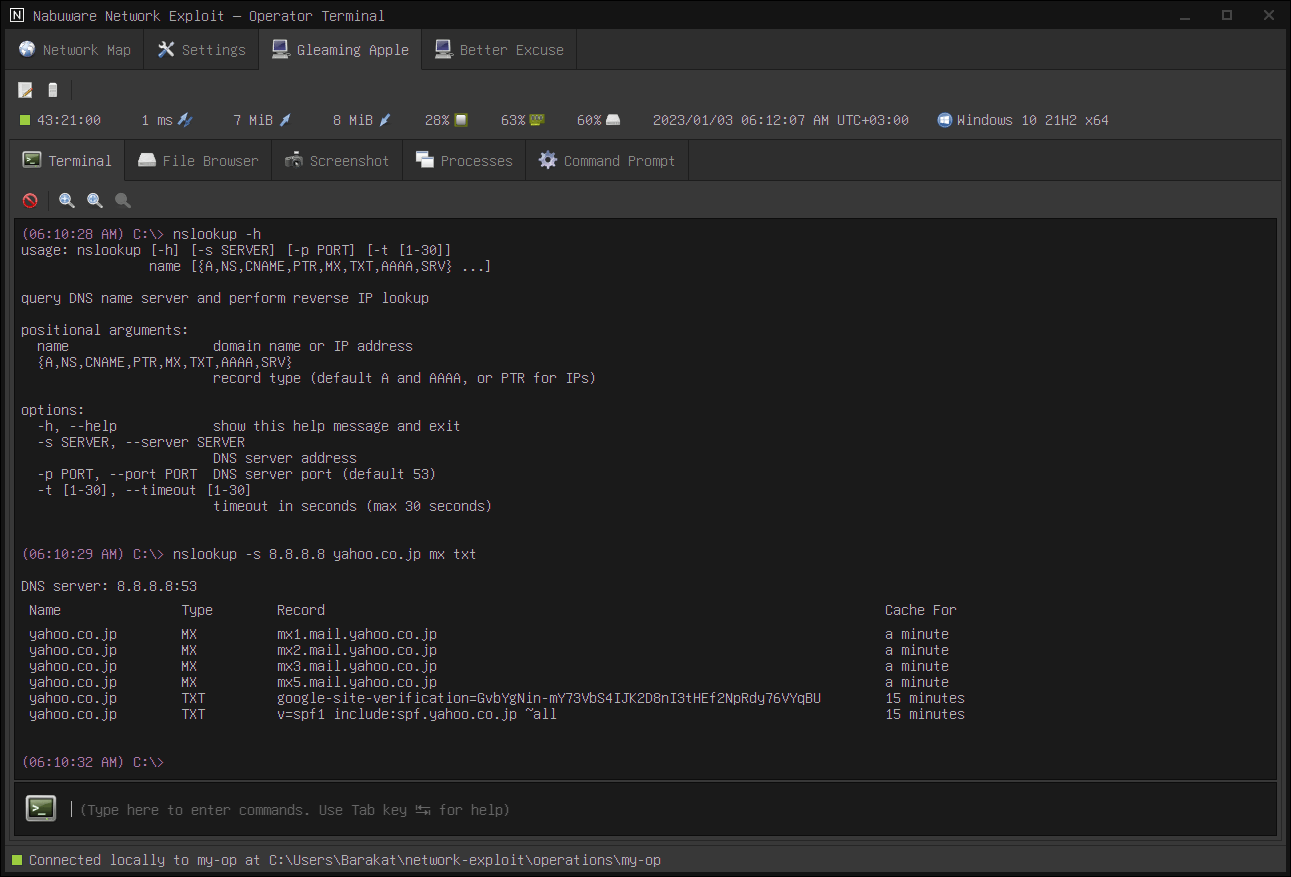
Let us consider the nslookup tool as an example, a built-in DNS reconnaissance tool:

If you were to analyze the implant, you would find nothing related to DNS because the logic runs entirely on your computer. The only part that runs on the target is the part responsible for exchanging UDP messages.
We had to solve many engineering challenges to make it work and be easy to use. The final result was excellent. We have been using this capability successfully to build Network Exploit.
In this update, we are making the scripting system available to you so that you can create your tools. It also comes with debugging support too. We are very excited to see what you will build with this capability.
The scripting system
This code is for a simple tool that gathers information about the target's processor from the registry. It should give you a feel of a typical Network Exploit script:
import asyncio

from trmsvr.plugin import script
from trmsvr.extension import registry
from trmsvr.extension.registry import RegistryHive

# shorthand
DESCRIPTION = 'Query target processor information'


async def main():
    parser = script.ArgumentParser(description=DESCRIPTION)
    parser.parse_args()

    arch, identifier, level, revision, cores = await asyncio.gather(
        registry.query_value(RegistryHive.LOCAL_MACHINE, r'SYSTEM\CurrentControlSet\Control\Session Manager\Environment', 'PROCESSOR_ARCHITECTURE'),
        registry.query_value(RegistryHive.LOCAL_MACHINE, r'SYSTEM\CurrentControlSet\Control\Session Manager\Environment', 'PROCESSOR_IDENTIFIER'),
        registry.query_value(RegistryHive.LOCAL_MACHINE, r'SYSTEM\CurrentControlSet\Control\Session Manager\Environment', 'PROCESSOR_LEVEL'),
        registry.query_value(RegistryHive.LOCAL_MACHINE, r'SYSTEM\CurrentControlSet\Control\Session Manager\Environment', 'PROCESSOR_REVISION'),
        registry.query_value(RegistryHive.LOCAL_MACHINE, r'SYSTEM\CurrentControlSet\Control\Session Manager\Environment', 'NUMBER_OF_PROCESSORS')
    )

    await script.print_pairs((
        ('Architecture', arch),
        ('Identifier', identifier),
        ('Level', level),
        ('Revision', revision),
        ('Cores', cores),
    ))


PLUGIN_SPEC = script.PluginScript(
    id='com.example.cpu-info',
    name='cpu-info',
    description=DESCRIPTION,
    main=main
)
The beauty of this scripting system is that you write tools as if they would run locally, which is true to a large extent, and you also have the full power of Python and its libraries at your disposal.
You may have noticed the async and await keywords in the previous code. Instead of fetching values sequentially, the system allows you to do things concurrently. It simultaneously initiates five calls to fetch values from the registry using registry.query_value() and waits for all five results to return at once. This approach saves considerable time.
Let's assume the network latency is 1 second round trip. A sequential version of the previous tool takes 6-7 seconds. However, this tool takes only 1-2 seconds to complete. The difference is vast when you have tens of such calls.
The concurrency extends to the implant too. The implant executes your calls concurrently, and when a call finishes, it returns immediately, allowing you to do multiple things simultaneously. The implant achieves this using virtual threads invisible to the operating system.
Creating and loading scripts
Creating and loading scripts is simple. To create a script, create a Python module with the name of your script under %UserProfile%\network-exploit\scripts, for example, %UserProfile%\network-exploit\scripts\cpu-info. Then, write your script in a file named __init__.py inside cpu-info.
To list scripts, use the command scripts. To load a script, use scripts load cpu-info. You can also unload scripts using scripts unload cpu-info.
There is no separate reload command. Just load the script again when you modify it.
Debugging support
We added two debugging mechanisms to help you solve issues in your scripts:
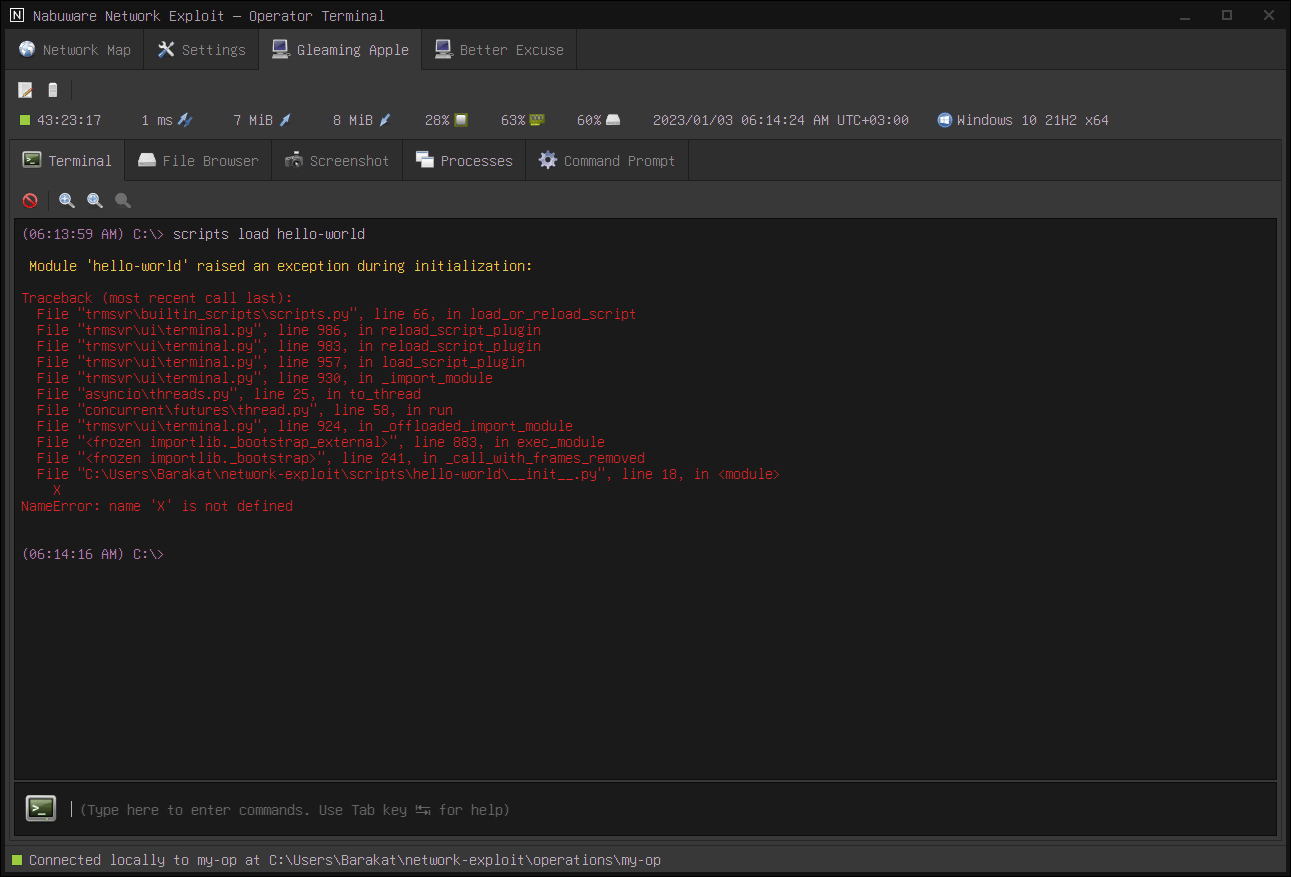
The first mechanism is the typical stack traces. This mechanism helps you catch most bugs. A stack trace will be displayed automatically if a bug occurs during the script loading:

If you have a bug in the main function, you can enable the stack traces for this particular script using scripts debug cpu-info on. This option is turned off by default.
The second mechanism is the debug server, which you can enable from the Development settings at the bottom of the Settings tab.
This mechanism allows you to set breakpoints, step through the code and inspect variables by connecting to the debug server using, for example, Visual Studio Code.
The following is a video of using the debug server to debug a code using Visual Studio Code:
Changes to the execute command
The execute command now executes both Beacon Object Files and .NET Assemblies. It automatically detects the file type and architecture. Pass the local file path and the arguments, and it will take care of the rest for you.
Beacon Object File support
This update adds Beacon Object Files (BOF) support. You can run most BOFs out there using the execute command followed by the BOF path and its arguments.
BOFs are inconsistent in encoding strings, so we added two flags to execute: --ansi to treat the BOF arguments as ANSI strings, which is the default option, and --unicode for Unicode.
We added the module trmsvr.extension.bof for BOFs that require a script to load. This module provides support functions to run such files. You can bundle the BOFs as resources in a directory called resources in the same directory as the __init__.py file.
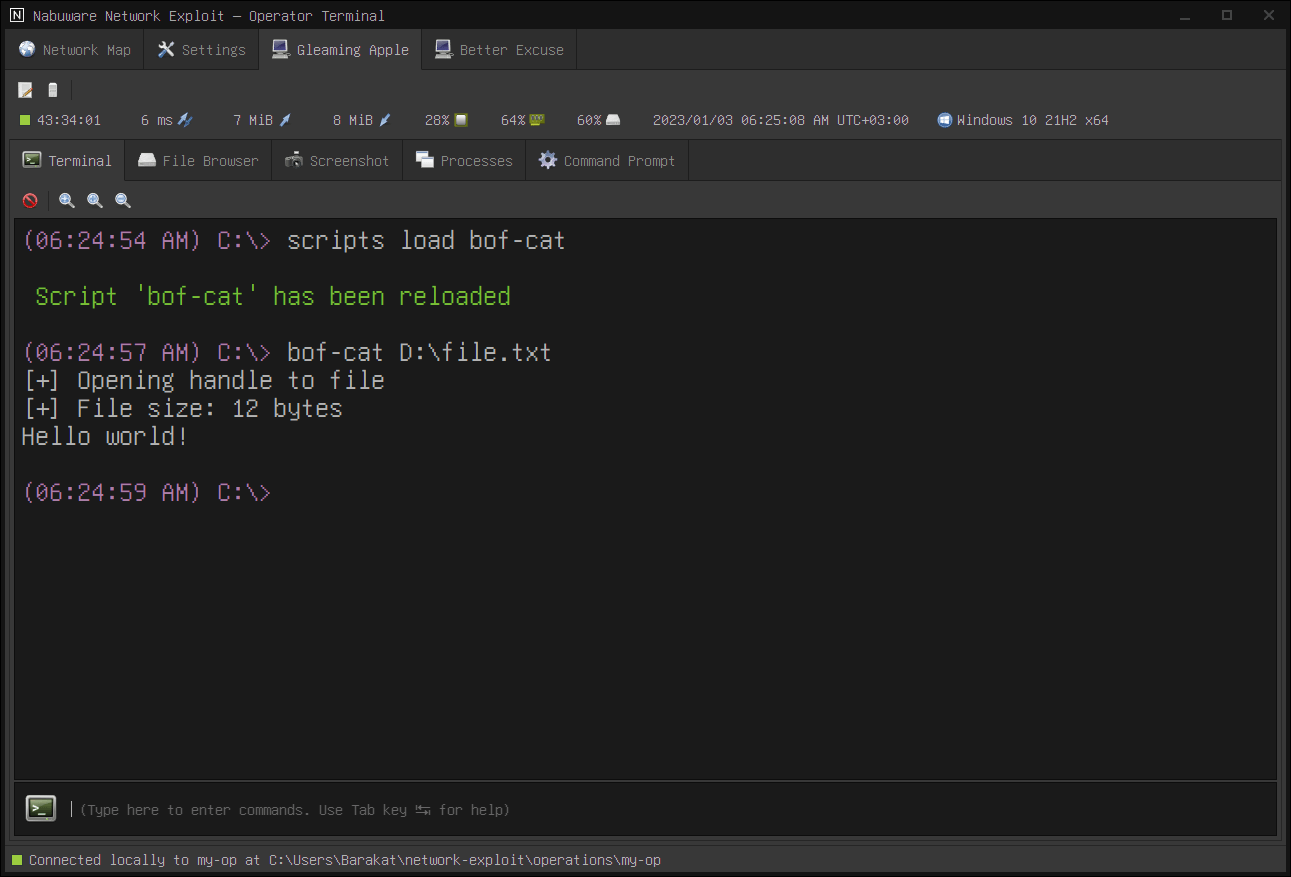
The following is an example of running BOF using a script:
from trmsvr.plugin import script
from trmsvr.extension import core, bof

# shorthand
DESCRIPTION = 'print file content (BOF)'


async def main():
    parser = script.ArgumentParser(description=DESCRIPTION)
    parser.add_argument('file', help='file')
    namespace = parser.parse_args()

    data = await script.read_binary_resource(
        'bof-cat',
        'cat.x86.o' if await core.x86_process() else 'cat.x64.o'
    )

    args = bof.pack('z', namespace.file)

    for _, text in await bof.execute(data, args):
        await script.print(text)


PLUGIN_SPEC = script.PluginScript(
    id='com.example.bof-cat',
    name='bof-cat',
    description=DESCRIPTION,
    main=main
)

As a side note, be careful when running untrusted BOFs. Verify the BOF and make sure it does what it claims to do.
.NET Assembly loader improvements
Some .NET Assemblies may have been compiled for a specific processor architecture. execute now handles such assemblies properly.
UI improvements
For those using multiple monitors, the Operator Terminal now opens the Window on the same monitor rather than always opening on the primary monitor.
This update also added a toolbar to the Terminal tab to make it look consistent with the other tabs.
Bug fixes
This update fixes a NULL pointer dereference bug that causes the implant to crash while shutting down if a specific task is pending. We reworked the teardown logic to eliminate this bug.
If you have any questions or want to purchase a Network Exploit, don't hesitate to contact us on the form below.
Happy new year!
Let's get in touch
Are you looking to purchase Network Exploit, or do you have any questions?